If you haven’t already, check out how I made my electronic wooden sculpture, and how I set up a wifi synchronized sound system in my house!
The way I got this music visualization working was by integrating SnapCast, C.A.V.A., and the NeoPixel library, all running on Raspberry Pi 3s.
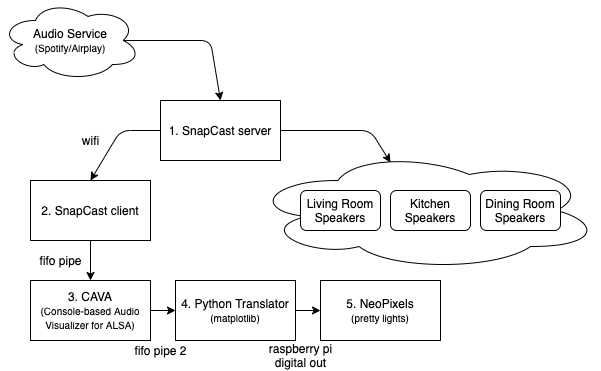
1. SnapCast Server
Snapcast is an amazing piece of open-source software. We used the server from SnapCast on one of the Raspberry Pis in our house which acts as the hub for our sound system. The hub server has other software which tricks devices on our home wifi to think it’s a smart Spotify device, and then SnapCast translates that into a broadcast to our network to any SnapCast client to seamlessly synchronize and play to audio.
2. SnapCast Client
The Raspberry Pi at the bottom of this wooden sculpture is set up to have a SnapCast client. It’s able to automatically sync with the hub and emit sound data to an audio output with perfect timing to other speakers in our house. In this case, I set that output to be to named pipe on the file system (/tmp/snapfifo).
3. C.A.V.A.
C.A.V.A. is a bar spectrum audio visualizer for the Linux terminal. It is originally built to analyze audio out of ALSA and generate a visualizer you would likely see in a Rainmeter background.
I used that visualizer to emit 3 bars, only 3 bars because there are 3 ring lights in my sculpture. Then I set the output of the visualizer to be to another file pipe as an ASCII output. That looked something like 0;0;0 for no music, bar heights are at 0. 255;0;0 for really loud frequency in the bass, and 0:0:255 for really loud frequency in the high notes.
4. Python Program
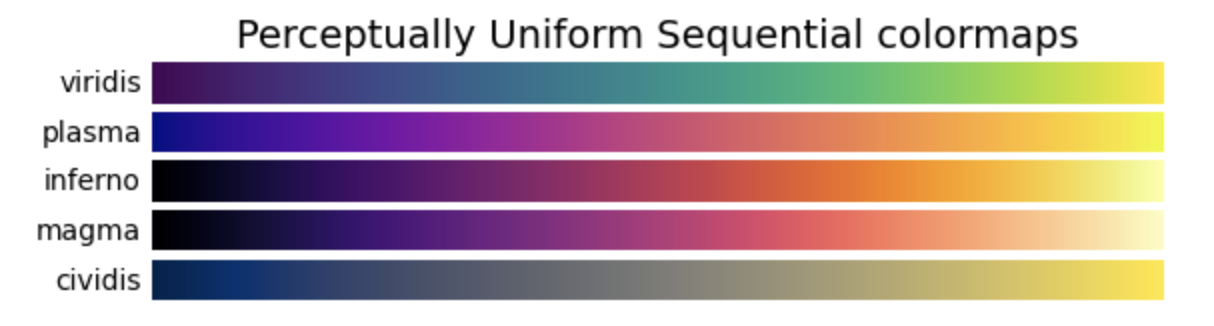
Then I got to work writing a python program to read these bar data from the file pipe, and then used the matplotlib cmap function to convert a # on a range from 0 to 255 to color from #000000 to #FFFFFF. And matplotlib lets you do that in many many different ways.
So all I had to do was set a cool color range (we started with inferno), translate those into red green blue channels and then send those commands down the line to the LEDs!
Crediting my roommate Robert Morrison for helping me find matplotlib cmap and for helping me write this bar height to color python script.
5. NeoPixel
NeoPixel has really nice python support, so our adapter proved pretty simple. I originally wired the 3 adafruit neopixel rings with all three LEDs on separate circuits and separate signal cables, but I had to go back and adjust the wiring so that the wiring was done in parallel (due to Raspberry Pi hardware limitations). This let me send a single signal down the line which was designed for a strip of 36 LEDs. The base ring would read the first 12 channels of data and forward 24 channels to the second ring. The second ring would read 12 more, and forward the last 12 to the highest ring. This let me treat the entire sculpture like 1 LED strip.
Extras
Play/Pause detection
Now I had a music program and a weather program on the sculpture, in order to make the two interact, I needed a way to tell the sculpture that music was playing and it needs to switch. To do this, I used Raspotify’s –onevent flag to trigger a python script which would make a get call to a flask service that controls the sculpture’s mode.
The script I wrote sends commands to change to the music mode on “playing” and change to weather on “paused”.
Different Color Maps
I wanted to make it change color maps when it got to a different song. The best solution which made sense was to use Raspotify’s “TRACK_ID” value, which is Spotify’s track id. I would have to use Spotify’s developer API to get the track name and details, but the ID was all I needed. I hashed the ID to get an integer translation of the track id, and then used that number with a modulus function to pick a color map from an array.
Now we had songs play and translate to their very own color mapping out of the color maps I handpicked. It was great seeing new colors for every song.